About time series metrics
A current-state view of risk answers what's broken right now. It cannot answer whether the team is getting better, and how fast. Dependency-Track records time series metrics so that the second question has an answer: every project, component, and the portfolio as a whole leave a trail of measurements that surface remediation progress, audit throughput, and posture drift across days, weeks, and quarters.
Snapshots, not deltas
A metrics record is a snapshot: a complete count of vulnerabilities, findings, suppressions, audit progress, and policy violations at a single moment, scoped to one component, project, or the portfolio. Reconstructing trends from deltas is fragile (a missed event corrupts the rest of the series), so Dependency-Track stores the absolute numbers and lets readers diff them.
Snapshots also explain a few behaviours users meet later:
- A suppression drops a finding from every snapshot taken after it lands. The historical series keeps the old, pre-suppression counts, which is exactly what a posture chart should show.
- The audit state of a finding (under triage, not affected, exploitable) feeds the audited/unaudited counters in the next snapshot, so charts reflect human progress, not just scanner output.
- A project's inherited risk score derives from the risk of its components, recorded in each project snapshot. Portfolio totals sum those project-level scores; the figure is never recomputed from child projects at read time for portfolio metrics.
The exact field set per scope lives in the
REST API reference, under the operations tagged
metrics.
When snapshots get written
Two things produce snapshots for a project and its components:
- Project-changing activity. A BOM upload, a vulnerability analysis run, or a manual reanalysis writes a fresh snapshot as the final step of that work. Active projects produce many snapshots per day; the series has higher resolution where the project sees more activity.
- A scheduled sweep. A platform-wide job runs every active project on a fixed schedule (hourly by default), so even an idle project lands at least one snapshot per day. This guarantees the series stays continuous and that retention windows behave predictably.
Portfolio snapshots are different, and the next two sections explain why.
Daily partitions and bounded retention
Component and project snapshots accumulate forever if nothing prunes them. Dependency-Track partitions both tables by day so retention is always a single partition drop, never a row scan. The cost of "delete a day of metrics" stays the same whether the table holds a million rows or a billion. That choice fixes the granularity ceiling (sub-day retention is not possible), which suits the analytical questions metrics aim to answer (week-over-week, quarter-over-quarter trends) operating at much coarser resolution.
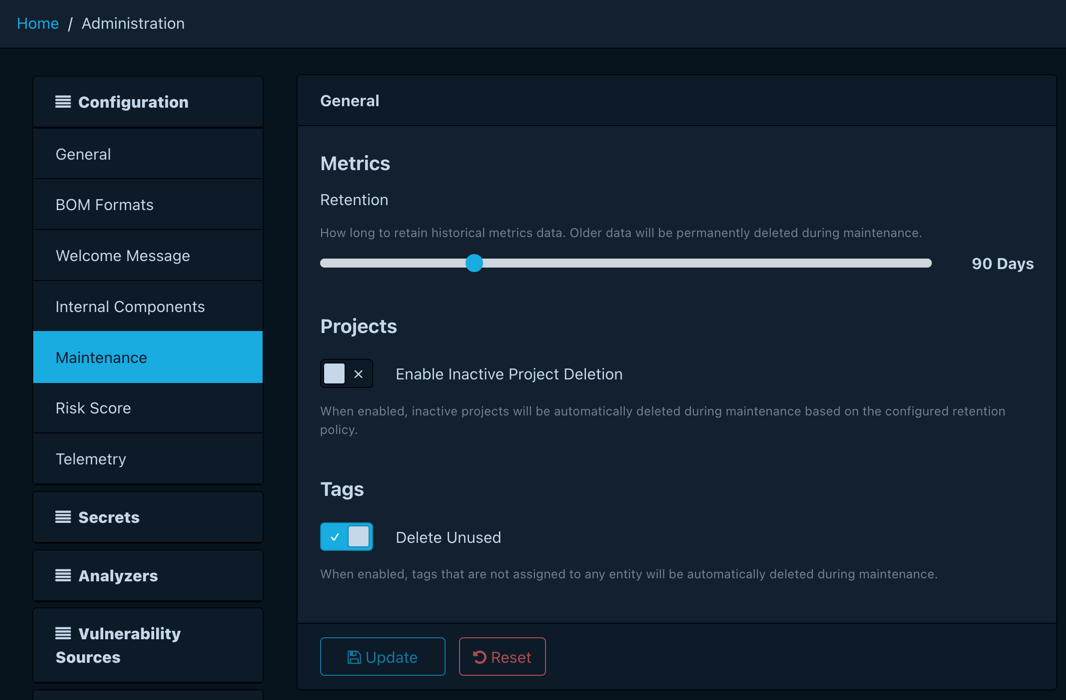
Retention is a configurable duration, 90 days by default. An hourly maintenance task drops out-of-window partitions and pre-creates the partitions for upcoming days. Administrators change the value at runtime, through the frontend or the REST API, rather than via a static startup property.
Two consequences fall out of the design: shrinking retention reclaims disk on the next maintenance cycle, and extending retention only affects data recorded from that point onward, because days that already aged out no longer exist.
Why portfolio metrics take two paths
Aggregating risk across an entire portfolio on every dashboard load degrades badly past a few thousand projects. Dependency-Track avoids that cost with a precomputed snapshot, then falls back to ad-hoc aggregation for the cases the snapshot cannot serve:
- Unrestricted callers (the default, with no portfolio access control, or a principal who bypasses it) read from a precomputed snapshot that refreshes after each portfolio metrics run. The work already happened in the background, so the read is cheap regardless of portfolio size.
- Restricted callers (those whom portfolio access control limits to a subset of projects) hit an ad-hoc aggregation instead. The query sums per-day project snapshots across the projects that caller can access. This stays cheap because the visible set is, by construction, smaller than the whole portfolio; the snapshot cannot serve them because it carries portfolio-wide totals, not per-caller filtered ones.
Collection projects sit outside the precomputed snapshot for the same reason inherited risk resolves at read time: their numbers sum the children's, so folding them into the portfolio total would double-count.
The unavoidable trade-off: the precomputed path lags live data by up to one refresh cycle, where the ad-hoc path is always current. For a posture trend chart this stays invisible; for a "did the last scan land yet" check it occasionally surprises.
Further reading
- About access control: the model that decides which portfolio path a caller takes.
- REST API reference: operations tagged
metricsdescribe the exact fields, request parameters, and response shapes.